

Contents
Applications of Fourier Transforms
by
Mhaske Viabhav(02D07018)
Avdhoot Bane(02D07016)
Gaurav bharjatiya 02007029)
Introduction:
Who was Fourier?Born in France in 1768, Jean Baptiste Joseph, Baron de Fourier came up with this piece of maths in his thirties after puzzling over problems with agriculture. Of great interest to him was the fact that the surface of the ground got quite hot during the day and cold during the night, but deeper down the temperatures were more nearly constant. He was seeking to understand heat flow.
Quarter of a millennium on, students of maths and engineering remain convinced he was seeking to impose misery and gloom on future generations. You will see that fourier analysis is used in almost every aspect of the subject ranging from solving linear differential equations to developing computer models, to the processing and analysis of data.
What is Fourier Transform?
Physical significance of Fourier Transform :
The Fourier Transform converts a set of time domain data vectors into a set of frequency (or per time) domain vectors.
Imagine you wanted to know about changes in soil temperature . Now suppose you to measure the temperature of the soil in your garden at dawn, midday, dusk and midnight, every day for a year. You would then have a list of real numbers representing the soil temperatures.
Now if we plot these readings on a graph the vertical y axis would be labelled 'temperature' and the horizontal x axis would be labelled ' time', we get a so called 'time domain' graph.
From the graph we infer the nights are cold and the days are warm and as it seems obvious, summer is warmer than winter!
The graph you've just imagined is (roughly) the sum of two sinusoids (sine waves). One with a frequency of one day as the temperature varies between day and night, the other with a frequency of one year as the temperature varies with the seasons.
The Fourier Transform provides a means of manipulating - or transforming - this raw data into an alternative set of data, the magnitude of which which can be plotted on a graph with differently labelled axis. Never mind the y axis label for now, but the x axis would now be labelled 'frequency' or 'per time' - this is in the 'frequency domain' graph.
This graph looks very different! It will consist of two vertical lines rising from the frequency axis, one at a frequency (or period) of one day, the other at a frequency (or period) of one year. Thus we have 'analysed' a seemingly complicated (rather than complex in the mathematical sense) set of data and extracted the most interesting facts from it - days are warmer than nights, and summer is warmer than winter! There is still more information we can extract from the raw results of the Transform not shown on such a graph, we can look at the 'angle' information of the raw results which might tell us that the coldest day isn't January 1st, and midnight isn't the coldest part of the night.
We could use exactly the same Fourier Transform for more interesting purposes - we could for example sample some music, transform it, and plot the 'frequency spectrum' to reproduce those dancing bars of LEDs on the stereo system!
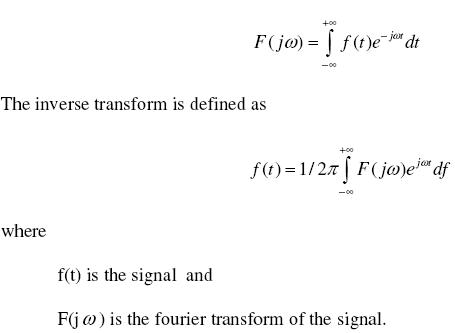
Mathematical explanation of Fourier Transform : The Fourier Transform is a generalization of the Fourier Series. Strictly speaking it only applies to continous and aperiodic functions, but the use of the impulse function allows the use of discrete signals. The fourier transform is defined as
Applications of Fourier Transform:
· Designing and using antennas
· Image Processing and filters
· Transformation, representation, and encoding
· Smoothing and sharpening
· Restoration, blur removal, and Wiener filter
· Data Processing and Analysis
· Seismic arrays and streamers
· Multibeam echo sounder and side scan sonar
· Interferometers VLBI GPS
· Synthetic Aperture Radar (SAR) and Interferometric SAR (InSAR)
· High-pass, low-pass, and band-pass filters
· Cross correlation transfer functions Coherence
· Signal and noise estimation encoding time series.

